


In today’s digital world, every business generates massive amounts of data. From marketing performance to financial results and customer engagement, the challenge is not collecting information—it’s interpreting it quickly and accurately. Business analytics dashboards bridge that gap, transforming raw data into actionable insights that guide smarter decisions.
These dashboards visualize performance metrics in real time, align teams under one truth, and provide executives with a clear overview of company health. Whether you run a small startup or a multinational enterprise, the right dashboard app can make the difference between reactive decision-making and proactive growth.
Here are the top seven apps for business analytics dashboards that stand out in 2025 for power, usability, and real-world impact.
1. Microsoft Power BI
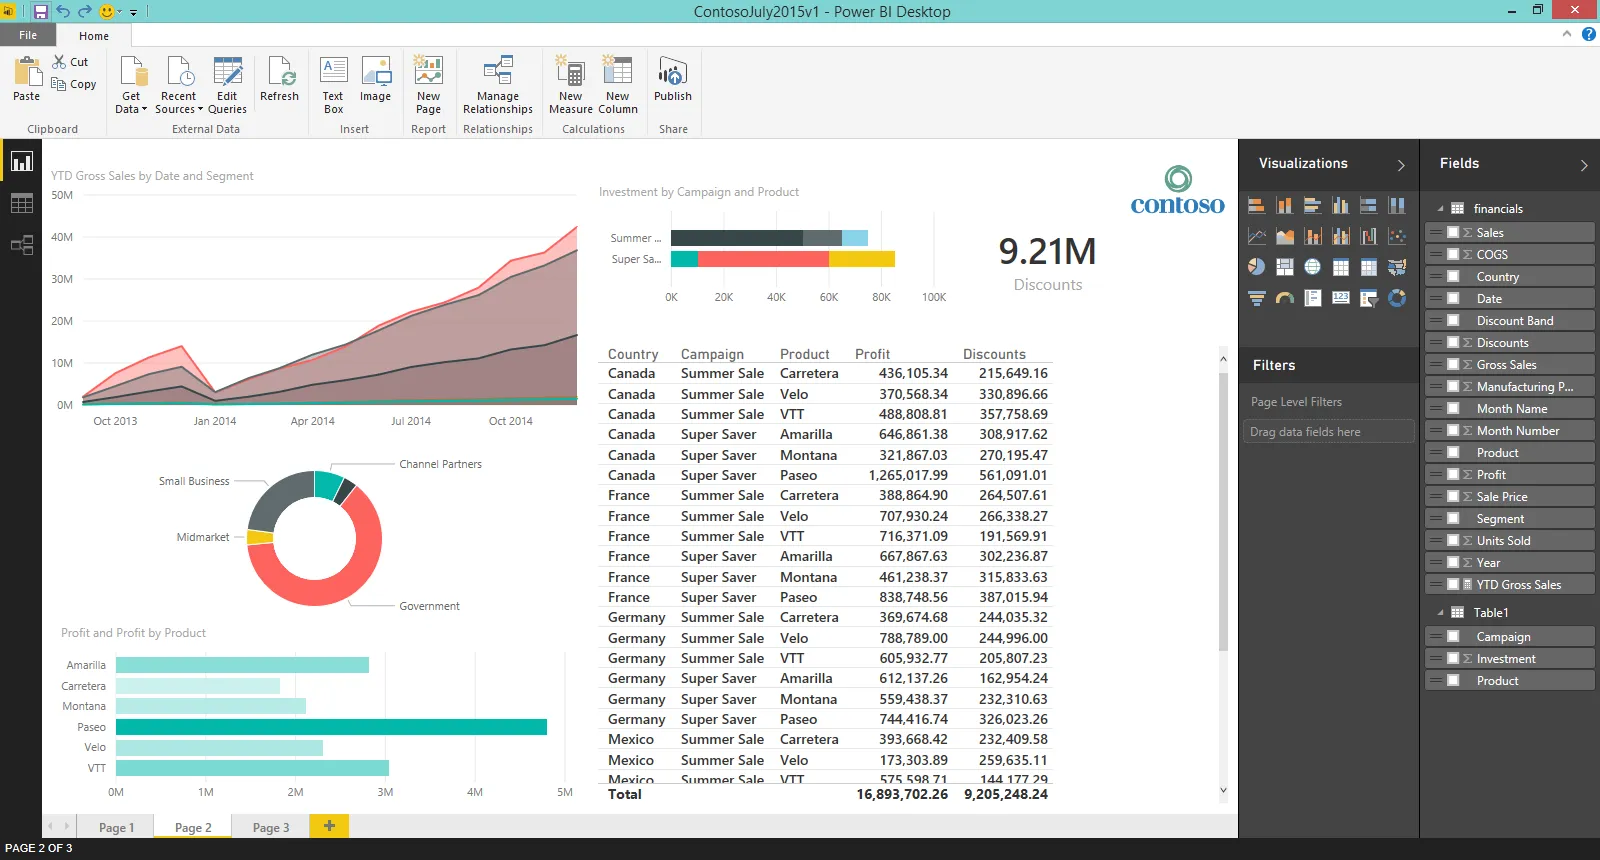
Microsoft Power BI has become synonymous with enterprise-grade data visualization. Known for its flexibility, integration, and deep analytical capabilities, Power BI allows businesses to turn data into clear visual stories that drive performance.
Its drag-and-drop interface makes dashboard creation accessible to everyone—from data scientists to marketing managers. Users can pull data from multiple sources, including Excel spreadsheets, SQL databases, CRM tools, and cloud storage. The integration with Microsoft 365 and Azure makes it a natural fit for companies already in the Microsoft ecosystem.
Power BI excels in real-time analytics. Sales teams can monitor daily revenue, operations can track production efficiency, and executives can view up-to-the-minute KPIs. Natural language queries even let users type questions like “Show sales growth by region” and get instant results. Combined with robust mobile support, Power BI gives every department the power to see, share, and act on insights anywhere.
2. Tableau
Tableau is often regarded as the pioneer of modern data visualization. It revolutionized how businesses interact with their data by making complex analytics intuitive and beautiful. Its visual appeal, speed, and interactivity have made it a favorite among analysts and executives alike.
The software enables users to blend data from different sources and build dashboards that tell stories through visuals—maps, scatter plots, heatmaps, trend lines, and more. Tableau’s ability to create interactive dashboards means users can drill down into specific data points, revealing deeper insights behind every metric.
Businesses across industries—from healthcare and finance to retail—use Tableau to visualize key performance indicators and share dashboards across teams. It’s powerful for discovering patterns, spotting anomalies, and predicting outcomes. While Tableau may require a learning curve for beginners, its analytical power and flexibility make it one of the best investments for companies that rely heavily on data-driven decisions.
3. Google Looker Studio
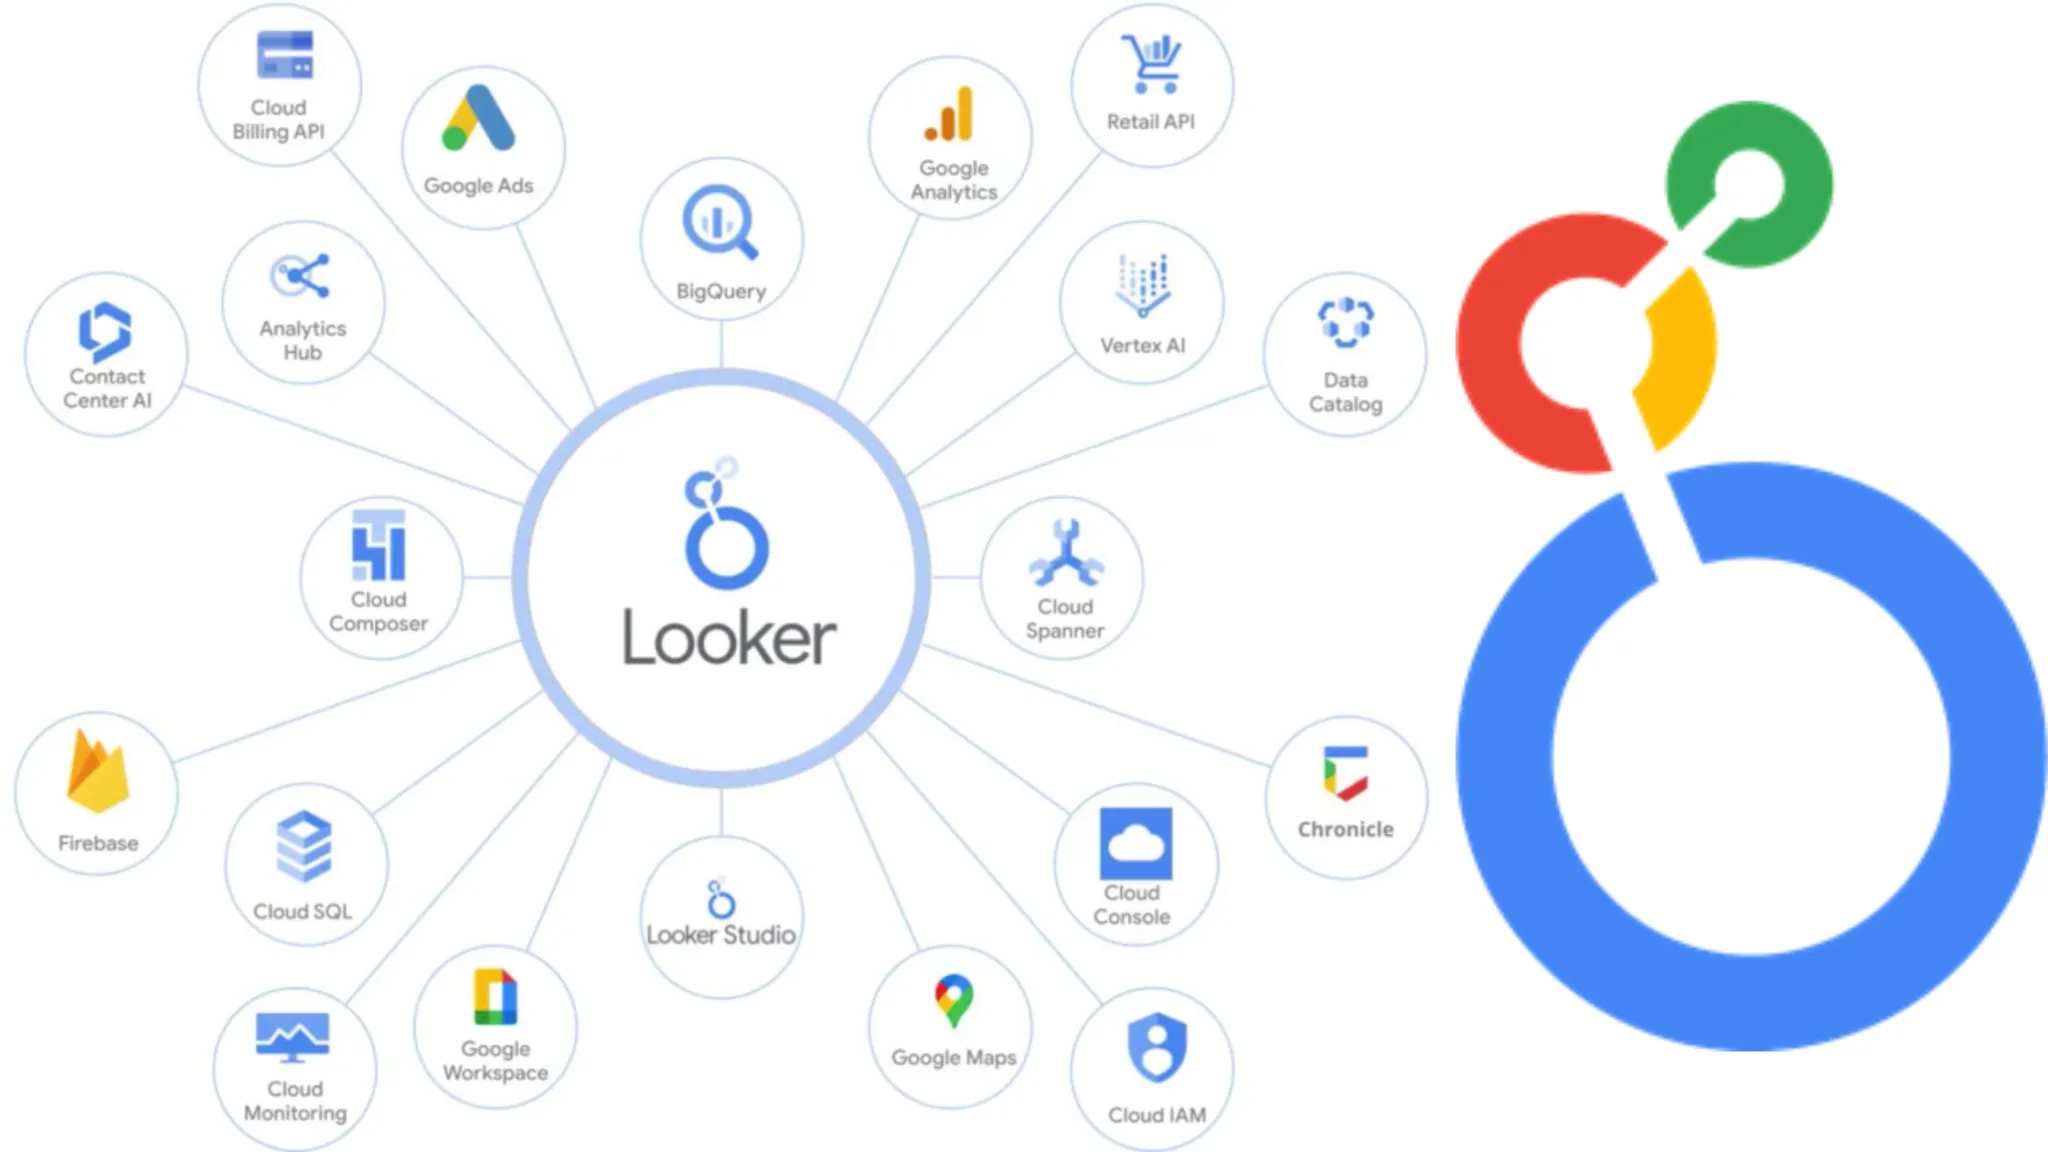
Formerly known as Google Data Studio, Looker Studio is Google’s answer to fast, accessible, and free data visualization. It’s ideal for marketers, small businesses, and teams that rely on Google Analytics, Ads, and BigQuery.
The platform’s simplicity is its greatest strength. With an intuitive drag-and-drop builder, users can design professional dashboards in minutes—without writing a single line of code. Dozens of built-in templates make setup easy, and users can connect data from hundreds of services through ready-made connectors.
Looker Studio is particularly popular for digital marketing and e-commerce analytics. A business can track website traffic, conversion rates, and ad performance in real time—all in one place. Collaboration features allow teams to edit dashboards simultaneously, ensuring everyone sees the same data. For businesses looking for agility, cost-efficiency, and speed, Looker Studio remains one of the most accessible analytics dashboard tools available today.
4. Zoho Analytics
Zoho Analytics brings powerful business intelligence within reach of small- and medium-sized enterprises. It’s part of the broader Zoho ecosystem, meaning seamless integration with Zoho CRM, Zoho Books, and other productivity apps.
Its standout feature is AI-powered analysis. With Zoho’s intelligent assistant “Ask Zia,” users can ask natural questions like “What was our monthly profit trend?” and receive instantly generated visuals. The platform supports data blending, allowing users to combine marketing, sales, and finance data into one cohesive dashboard.
For example, a retail company could merge its sales data with customer feedback to uncover which product categories drive the most satisfaction. Automated reporting, scheduled email delivery, and strong data governance tools make Zoho Analytics reliable for ongoing business monitoring. It’s affordable, scalable, and especially valuable for growing organizations that want enterprise-level capabilities without the enterprise-level cost.
5. Qlik Sense
Qlik Sense differentiates itself through its associative data engine, a unique approach that lets users explore information freely rather than following rigid query paths. This means you can start anywhere in your data—by product, by region, by sales channel—and discover hidden connections across datasets.
Its interface is modern and highly interactive. Dashboards respond dynamically as you click through data points, allowing non-technical users to find insights without needing SQL or scripting. Qlik Sense also offers AI assistance, predictive analytics, and collaboration tools, making it powerful for organizations that rely on quick, flexible decision-making.
Industries like logistics, manufacturing, and healthcare use Qlik Sense to visualize complex data relationships—tracking supply chain performance, predicting inventory shortages, or analyzing patient trends. Its combination of flexibility, intelligence, and enterprise security makes it one of the most advanced tools for exploratory analytics.
6. Domo
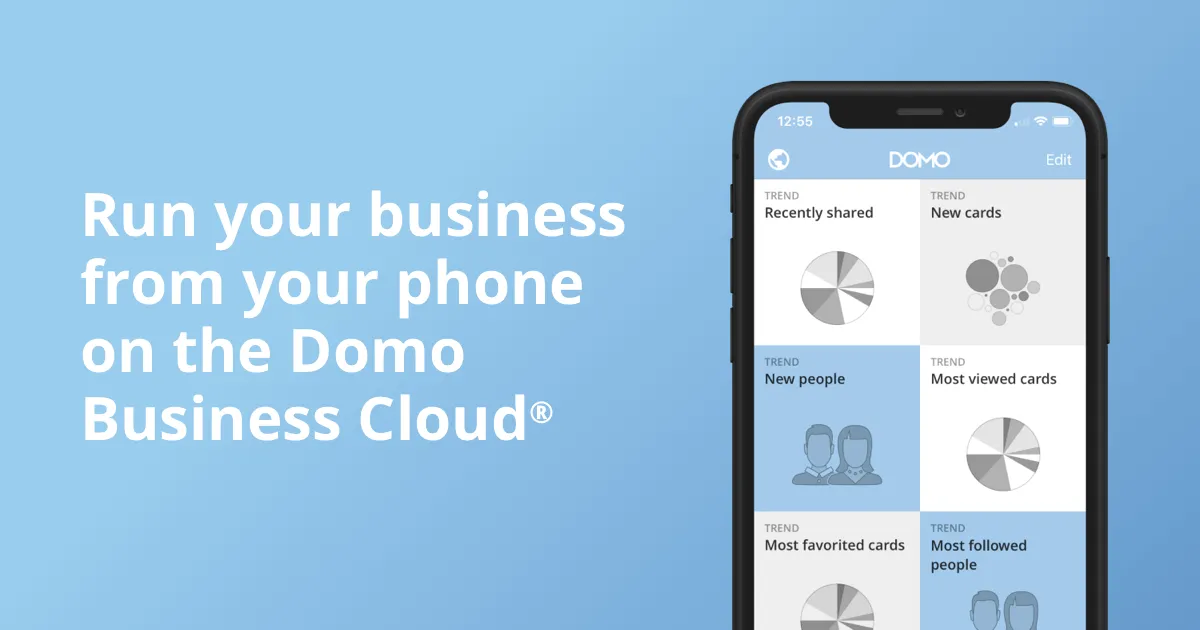
Domo is built for real-time business intelligence. Designed with a mobile-first mindset, it delivers live dashboards and alerts that keep decision-makers informed on the go. For organizations that thrive on agility—like e-commerce, marketing agencies, and fast-moving consumer goods—Domo is an ideal fit.
It connects to hundreds of data sources, from social media and advertising platforms to ERP systems and databases. The system automatically updates metrics and sends notifications when thresholds are reached, enabling instant action. Managers can monitor sales performance, customer satisfaction, or ad campaign ROI from a smartphone, ensuring no decision is delayed.
Domo also emphasizes collaboration. Teams can comment directly on dashboards, assign tasks, and share insights seamlessly. Its visually engaging interface, AI-powered forecasting, and enterprise-grade scalability make Domo one of the best platforms for businesses that require speed, connectivity, and continuous insight.
7. Databox
Databox is a mobile-friendly dashboard app designed for simplicity and collaboration. It’s especially popular among small and mid-sized teams in marketing, sales, and customer success. The platform provides ready-made templates, fast integrations, and smooth automation for tracking performance metrics.
Within minutes, users can build dashboards that connect to HubSpot, Google Analytics, Facebook Ads, Shopify, and more. Data updates automatically, giving real-time insights into performance goals and KPIs. The app’s “Scorecards” feature sends daily summaries to your phone, making it easy to stay on top of trends without opening multiple analytics tools.
Databox’s biggest advantage lies in accessibility. Even users without analytical training can visualize progress toward targets, set performance alerts, and share results with clients or teammates. For small businesses or agencies that need fast, clear reporting with minimal setup, Databox delivers both efficiency and insight.
Why Business Analytics Dashboards Matter
In today’s competitive environment, data literacy is a core business skill. Dashboards help companies move beyond intuition toward evidence-based decision-making. They centralize key metrics, making performance visible across departments and levels.
- Real-time decision-making: Dashboards show live data, not last week’s report, empowering leaders to act immediately.
- Cross-team transparency: Everyone sees the same metrics, ensuring alignment between sales, marketing, and finance.
- Efficiency: Automated reporting replaces hours of manual data collection.
- Accessibility: Mobile dashboards and AI assistants make insights available to everyone, not just analysts.
- Continuous improvement: Visual trends reveal problems before they escalate and highlight successes worth replicating.
Analytics dashboards are no longer optional—they are the foundation of a data-driven organization.
How to Choose the Right Dashboard App
The best app depends on your business size, budget, and data maturity. Here’s how to choose wisely:
- Assess your data sources: If you rely on Google services, Looker Studio may be ideal. Microsoft users will benefit most from Power BI.
- Consider user skill level: Tableau and Qlik Sense offer depth but may require training. Zoho Analytics and Databox are easier for beginners.
- Define scalability: Startups can begin with lightweight apps and upgrade as data complexity grows.
- Prioritize collaboration: If multiple departments share dashboards, look for tools with built-in commenting and sharing features.
- Evaluate mobility: Executives on the move should pick platforms like Domo or Databox, optimized for mobile use.
- Plan for governance: Ensure the app supports secure access, role-based permissions, and compliance with data policies.
By matching these criteria to your company’s workflow, you’ll maximize the return on your analytics investment.
The Future of Business Analytics Dashboards
As AI and machine learning become standard features, dashboards are evolving from descriptive tools into predictive engines. Future systems won’t just report what happened—they’ll forecast what will happen next. Voice-activated analytics, automated anomaly detection, and deeper personalization will redefine how businesses consume insights.
Additionally, the integration of augmented analytics will allow dashboards to automatically highlight patterns users might miss. These advancements mean that even small businesses can leverage enterprise-level intelligence without complex infrastructure. The goal is simple: turning every employee into a confident, data-driven decision-maker.
Final Thoughts
Data is only as valuable as your ability to understand it—and business analytics dashboards make that possible. Whether you’re visualizing quarterly performance or monitoring real-time customer behavior, these tools turn information into strategic clarity.
From Microsoft Power BI’s integration strength to Tableau’s stunning visuals, Looker Studio’s accessibility, Zoho Analytics’ affordability, Qlik Sense’s discovery power, Domo’s agility, and Databox’s simplicity—each app offers unique advantages for different business needs.
Selecting the right platform empowers teams to make faster, smarter, and more confident decisions. In 2025 and beyond, the organizations that harness their data effectively will be the ones that lead, innovate, and thrive.